
MarketRunner
Find the Signal. Ignore the Noise.
See what the data says about a stock this quarter.
Type a symbol. Get a clear bullish or bearish research framing from earnings, price action, and market context.

Scroll inside the phone
MarketRunner
Find the Signal. Ignore the Noise.
Type a symbol. Get a clear bullish or bearish research framing from earnings, price action, and market context.
Scroll inside the phone
MarketRunner is a stock research tool that pulls together earnings expectations, recent price behavior, and related market context for a ticker you choose.
Instead of digging through dozens of screens, you get a plain-language research framing you can check anytime, with earnings expectations as one part of the picture, not the only input.
Three steps. No spreadsheets required.
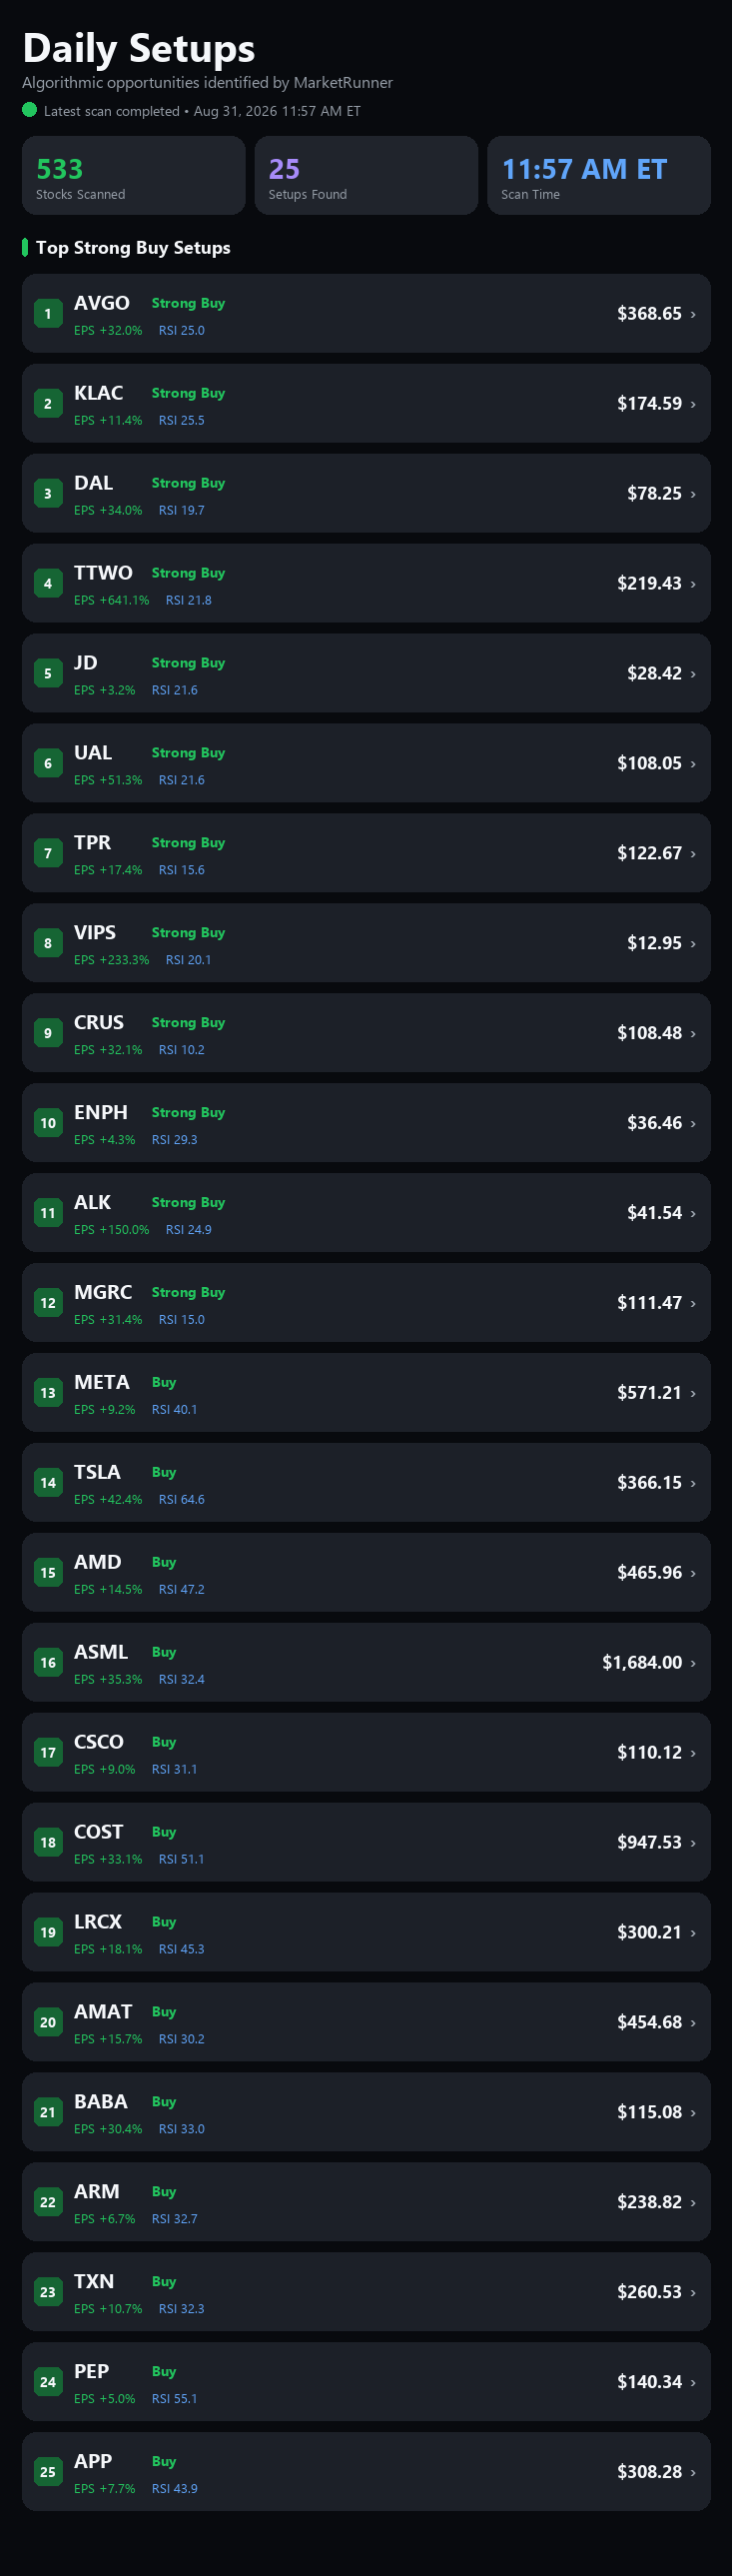
Daily Setups are MarketRunner’s algorithmic recommendations, produced by the same scoring rules as the dashboard, not recommendations from any individual analyst or person.
The list is queued to refresh once each weekday. Updates are usually available in the afternoon, typically between noon and 2:00 PM ET. Names are ranked by signal strength, then by market cap and liquidity, so you can review the strongest Strong Buy and Buy setups in one scroll. Tap any ticker in the app to open the full dashboard.
Example from the Aug 31, 2026 session. Scroll the preview to browse the full list.
Scroll to see the full list
Paper Trading: Hypothetical/Simulated Performance
Strong Buy and Buy signals from Daily Setups are placed in a MarketRunner-operated paper account so you can review simulated results before signing up.
Paper trading does not represent actual customer investment results. Simulated performance has inherent limitations and may differ materially from live trading. Past or simulated performance does not guarantee future results. How this is calculated · Full disclosure
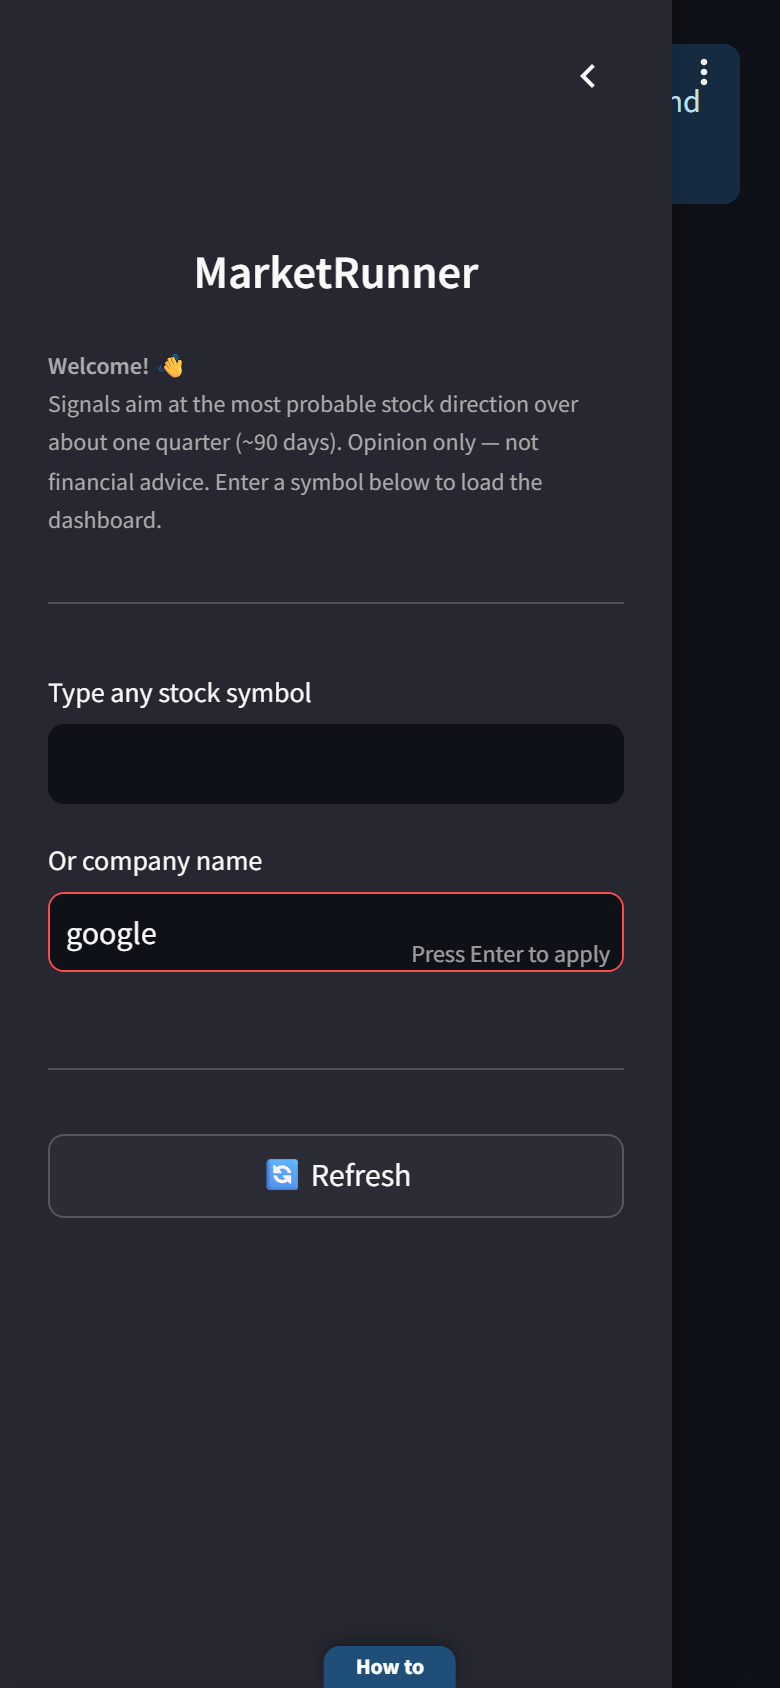
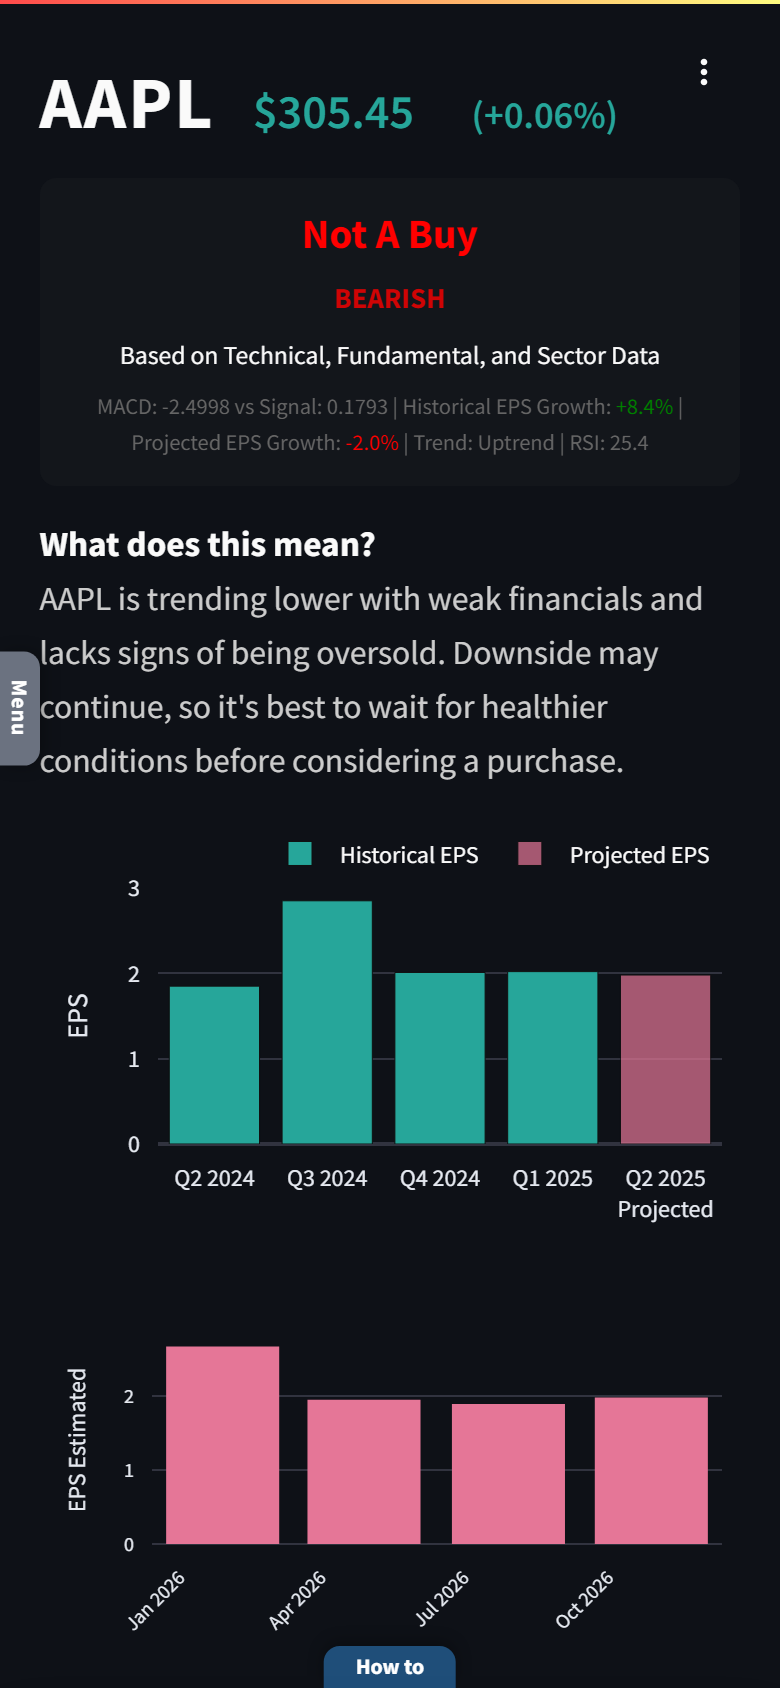
Open the menu, type a ticker, and the dashboard updates. Charts for financials, estimated EPS, and revenue sit under a short “what this means” explanation so you can move from question to context in one scroll.
Designed for phones first. Same idea on the go: less clutter, fewer taps, a straight answer you can revisit when markets move.
Create an account to get started, or log in if you already have one.
MarketRunner is operated by MarketRunner LLC. MarketRunner provides informational analysis and educational content about publicly traded securities. It is not describing itself as a broker-dealer, investment adviser, bank, or fiduciary, and it does not provide personalized investment, tax, legal, or accounting advice.
Nothing on this website or in the MarketRunner application constitutes an offer to sell, a solicitation to buy, or a personalized recommendation of any security, strategy, or transaction. Any labels such as “Strong Buy,” “Buy,” “Possible Buy Here,” “Hold For Now,” “Possible Sell Here,” “Too Risky,” “Not A Buy,” “Strong Sell,” “bullish,” or “bearish” are automated, opinion-based framings generated from available data models and should not be treated as advice tailored to your situation.
Investing involves risk, including the possible loss of principal. Past performance, and any historical chart, estimate, paper trade, or back-tested result, is not indicative of future results. Markets can move quickly; data may be delayed, incomplete, or inaccurate.
You are solely responsible for your investment decisions. Before acting, consider your objectives, experience, and risk tolerance, and consult a qualified professional if you need advice. By using MarketRunner, you agree that we are not liable for decisions you make based on the information shown.
How scoring works · Paper methodology · Terms of use · Privacy · Disclosures